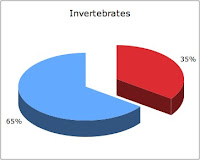
Below are some graphs, illustrating the most recent statistics. Red areas represent species that are threatened. One thing to keep in mind while looking at these charts--these graphics represent only species that are assessed by the IUCN. So, although just about all of the known mammal, amphibian, and bird species have been described and assessed, only small percentages of the world's known plants, invertebrates, fish, and reptiles, have been assessed. Which of course means that there are a lot of species out there whose status is unknown. They may be threatened or not--we just don't know. If you're interested in more details, check out the Summary Statistics published by the IUCN.


